
Metrics for Climbers | Strength and Endurance Standards
Note: The tables at the end of the post will be regularly updated based on our current data set. Most recent update: October 2022.
A note from Kris:
Keep in mind that all of these numbers are suggestions and intended to guide your training in an efficient and effective way. They are not, and never will be, a replacement for a complete understanding of the needs of the climber. Even if it were possible to come up with a number that represented the best possible metric for any given attribute (it isn’t) it would still be a very small piece of a much more complex puzzle. Don’t let the illusion of the data fool you into making it your focus.
From our Data Analyst, Dale: What These Tables Consist Of and How To Use Them
These tables consist of all the measurements included in our client assessment and cover a range of areas from sport specific strength & power, to sport specific energy systems, and general fitness.
The grades listed across the top are the max outdoor grade. Within each cell of the table you’ll find a range. This range is the mean minus one standard deviation (smaller number) to the mean plus one standard deviation (larger number) for the measurement given at the left from our client dataset. In an ideal normal distribution this range would represent about 68% of the population who have climbed that maximum outdoor grade. Below the smaller number would be an additional 16% of the population who have climbed that grade and above the larger number would be the remaining 16% who have climbed that grade.
If you just want an average value to shoot for, add the larger and smaller numbers together, divide by two, and you’ll get the mean.
Want to know the standard deviation? Subtract the mean from the larger number.
The table and diagram below shows an example using the V7 grade for the Weighted Pull-Up measurement. The more mathematically oriented of you will realize that the information in this table can be used to derive probability density functions and cumulative distribution functions for calculating the probability of climbing a given grade based on a current measurement. This is the method implemented in our client assessments.
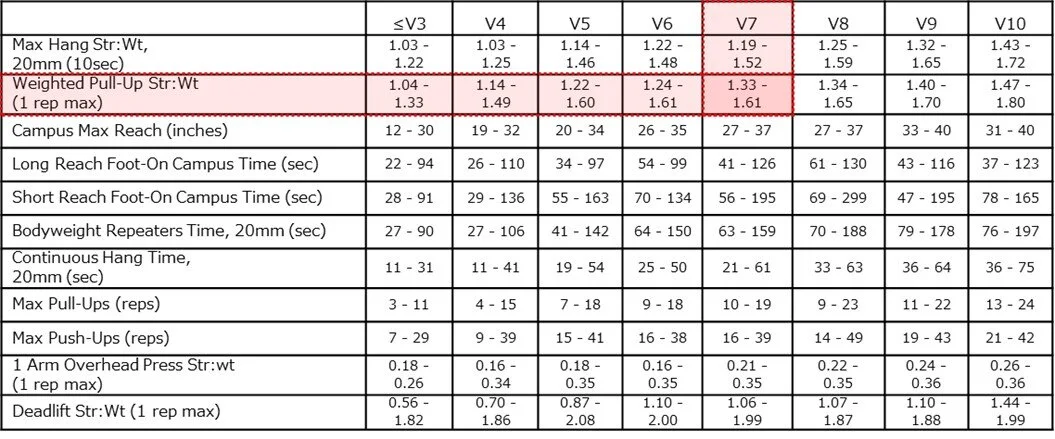
This table used for explanatory purposes; see tables at end of the post for accurate and updated data.
A simple and effective way to use this table is by looking at the measurement range for your current given project grade. Where does your current measurement fall, and what can we learn from it? See the diagrams below.

This table used for explanatory purposes; see tables at end of the post for accurate and updated data.

This table used for explanatory purposes; see tables at end of the post for accurate and updated data.
Land of Low-Hanging Fruit
If you find yourself here this attribute may be a good target for you to address in your training. What does “address in your training” mean exactly? A variety of things. If, say, your Max Hang measurement is below the provided range for your project grade maybe you start adding some hangs into your sessions twice per week. However, just because the measurement is taken on a 20mm edge with weight for 10 seconds that doesn’t mean that’s always the most effective way for you to build the quality evaluated in the test. Repeating hard boulders that consist of “finger-y” holds would be a more sport specific but less quantifiable way for you to develop this attribute. If you’re stuck at home with only a hangboard maybe hangs are the road you have to walk. A variety of approaches work for increasing any of these attributes. Don’t be a zealot for certain set or rep schemes. Pick something that you’ll actually do and that works with the resources available to you. Stick with it for a month or two and see where you’re at. Also, if you find yourself below the range provided for your project grade don’t abandon your project. Try it and try hard on it. Figure out what is missing in your bag of tricks as the problem may not even rely on this quality, or you may be able to leverage other skills or physical attributes to send.
Somewhere in the Middle
You’re within the range provided for your given project grade in the table. This just means that the probability of you having an adequate amount of the attribute evaluated in the measurement to send a project at that grade is pretty high. That doesn’t mean that the grade will feel easy or will even necessarily go for you right now. You should probably be including activities that continue targeting this attribute in your training, but it might not be the first and foremost attribute you need to work on. It may be a good time to look at what your project specifically requires of this attribute. If your Max Hang measurement is within the range, but your project involves pulling on 6mm crimps in a near-vertical setting, then maybe practicing your full crimp will serve you better than adding another 10lbs on a 20mm edge.
Land of Diminishing Returns
Your current measurement exceeds the range provided for your project grade. The probability that you have an adequate amount of the attribute tested to send a project in this range is pretty high. It might be time to set this one to “simmer” for a bit and drop the frequency of training activities that build this attribute to once per week or so. Your time is most likely better spent focusing on attributes you have lower measurement results in and really digging into the specifics of what your project requires. If you’re trying to send “The Orb” at Rocktown, a power endurance test piece, don’t think you’re going to walk up it just because your Bodyweight Repeaters measurement is on the high side for V8 in this table.
About Our Data
Our dataset consists of over 600 assessments from our client base. It’s also open to the public to submit results via the link you’ll find later in this post. Our results are not peer-reviewed scientific literature. They’re intended to help coaches and clients determine how best to spend their training time. Our sample sizes at each grade vary from n = 15 up to n = 60+, with sample sizes for other grades falling between those. If you have any questions or would like to perform your own analysis with this data, please don’t hesitate to reach out.
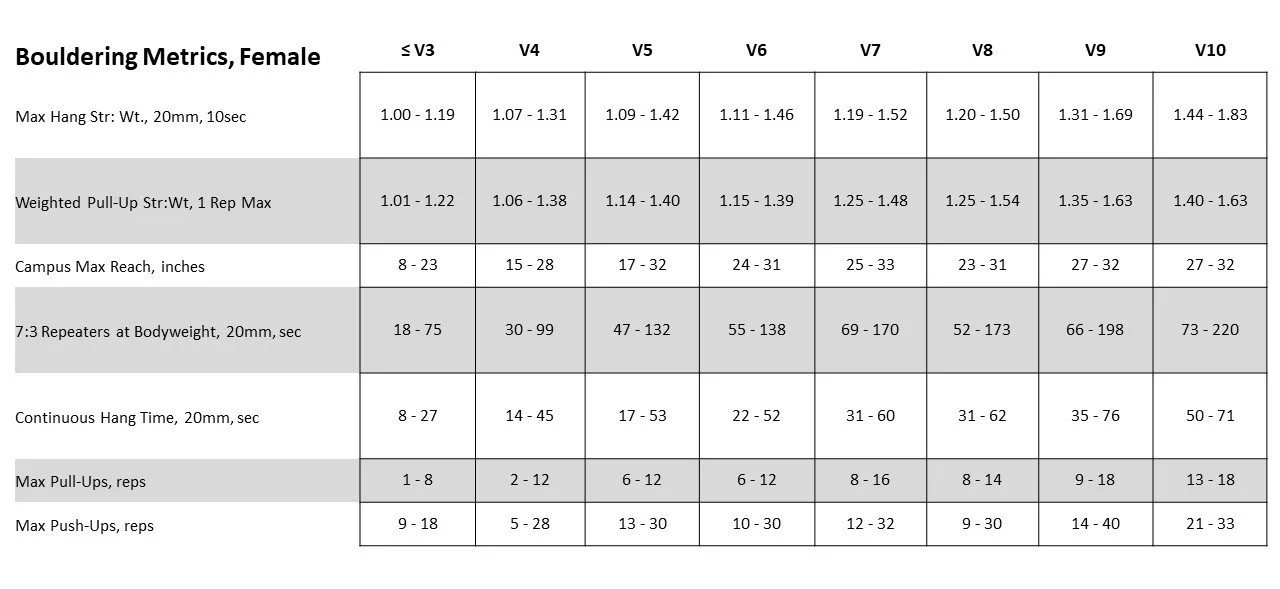
THE TABLES
Bouldering

Sport Climbing


We always appreciate more submissions to the dataset. We know it’s a long assessment, so even if you only contribute a few of the measurements, we appreciate you!


Improving movement skills is by far the most abstract part of becoming a better climber. And arguably the most important part.